Live Map
See your entire operation at a glance. The live map shows every asset's current position and zone in real time, giving you instant situational awareness without leaving your desk. Switch to Trips to see where those assets have been. Spot assets that are out of place, trace where something has been, and drill into any tag for its full history.
The map view
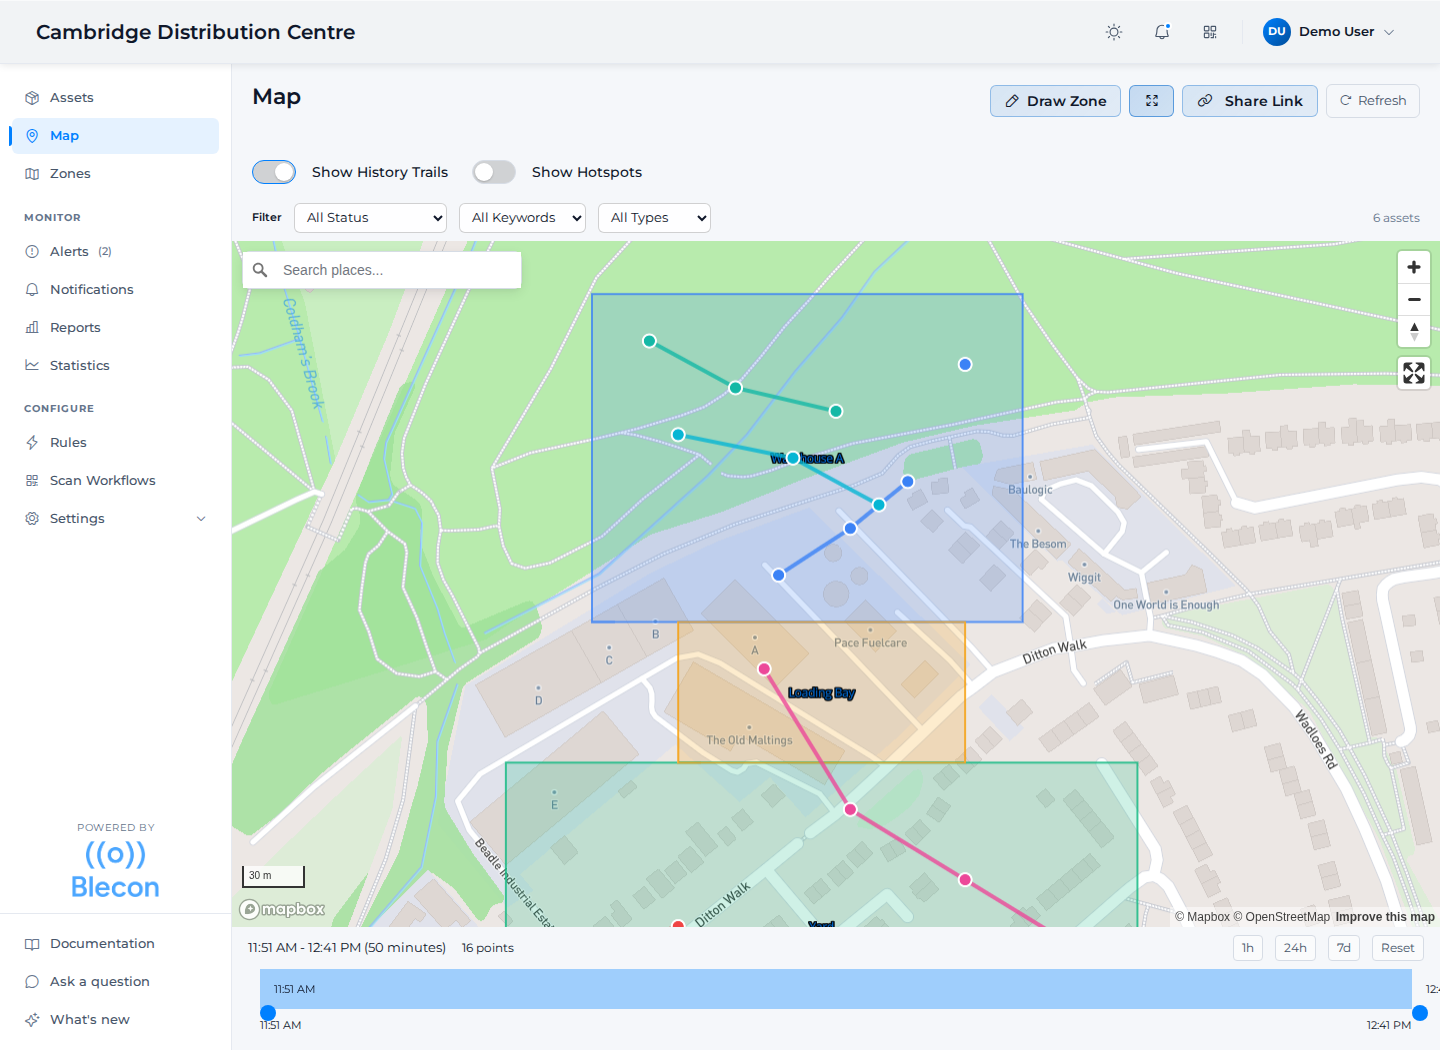
The map shows:
- Asset markers: Each tracked tag appears as a marker at its current position. Marker colour shows the age of the tag's last position: blue when it is under 24 hours old, orange when it is over 24 hours old, and red when the tag has been missing for 7 days or more.
- Zone overlays: Zones are drawn on the map as shaded regions with labels.
- Clusters: Tags close together group into a neutral numbered bubble. Click a cluster to zoom in. Tags at exactly the same spot stay grouped at every zoom; clicking lists each one with its age colour, so you can open or archive it directly.
- Large sites: When more than 10,000 tags are in view, each bubble counts every tag in its area, and the total above the map counts them all. Zoom in to see single tags. Where many tags share one spot, clicking the bubble tells you how many are there. Filter by keyword or type to see them one by one. Click any asset marker to open its popup, with the last position time spelled out and quick actions: filter the map to that tag, open its details, or archive it.
Live, Trips and Raw
The switch above the map has three modes.
Live is the map described above: where every asset is now.
Trips replaces the markers with the journeys each asset made. Every trip is drawn as its own coloured line, from where the asset set off to where it stopped. Click a line to open that trip.
Raw replaces the trip lines with the individual position reports, one point per report. The trips are the shape of the day. The raw points are the evidence behind them. Use Raw to check what a tag reported, including in places where no trip was detected.
With more than 100 assets on the map, Raw draws the points without the lines between them, so the map stays responsive. To see the lines, filter by keyword or type until 100 or fewer assets remain, or click a point and choose Only This.
Trips and Raw are modes, not layers. The live markers are hidden while either is on, because a marker at today's position and a line from this morning answer different questions.
The timeline along the bottom of the map sets the window that Trips and Raw draw from. Use the 1h, 24h and 7d buttons for a quick range, drag the handles for a precise one, and Reset to go back to everything. The timeline also states how many positions are in the window.
Trip lines are drawn per trip, so an asset that made three runs today shows three lines, not one line threaded through everything it did.
Map controls
- Zoom and pan: Navigate the map to focus on specific areas.
- Time range: In Trips or Raw, adjust the timeline to see movement over hours or days.
- Asset filtering: Use the assets list to find and highlight specific tags.
- Filters: The filter dropdown narrows the map by last-position age, using the same buckets as the marker colours and the asset list: last position under 24 hours, over 24 hours, or missing (7 days or more). You can also show archived tags, or everything at once.